Our green “buy” or red “sell” predictions are perfect for short-term traders seeking a 5-15 minute Bitcoin price direction. Ideal for leverage trading!
For stable trend analysis, use our “Trend 60m” indicator. If the value remains stable with a slight upward trend (without drops exceeding 0.5%) over the next 10-20 intervals, this indicates a reliable “buy” signal.
Conversely, if the “Trend 60m” shows instability with a downward tendency, the overall trend is either unstable or likely to become a downtrend.
Example 1:
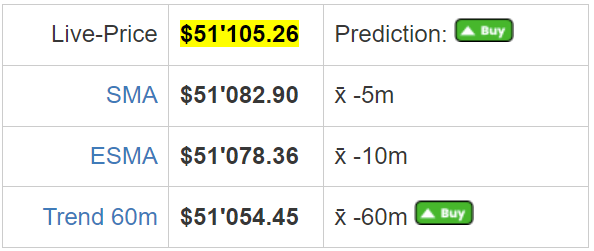
The current ‘Live-Price’ is exceeding both the SMA (5-minute average) and ESMA (10-minute average), along with a positive ‘Trend 60m’ indicator. This signals a strong uptrend. However, markets can reverse quickly, so it’s wise to monitor longer timeframes (10-20 minutes) to confirm trend stability before making any trading decisions.
Example 2:
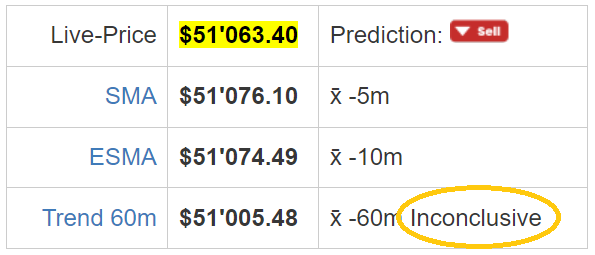
The current ‘Live-Price’ is below both the 5-minute (SMA) and 10-minute (ESMA) averages, as well as the ‘Trend 60m’ indicator. This suggests short-term downward momentum. However, the ‘Trend 60m’ is inconclusive, indicating potential sideways movement. It’s best to monitor longer timeframes (10-20 minutes) to confirm trend stability before making trading decisions.
Indicators of Short-Term Trends
- Trend Identification: The 60 ESMA average helps in identifying the short-term trend of Bitcoin rates. If the current rate is above the 60 ESMA average, it’s often considered to be in a short-term uptrend, and conversely, if it’s below, it may be in a downtrend.
- Price Stability: This average can also give an indication of the stability of the Bitcoin price over the short term. A more stable or consistent ESMA average suggests less volatility, whereas significant fluctuations in the ESMA average might indicate higher volatility.